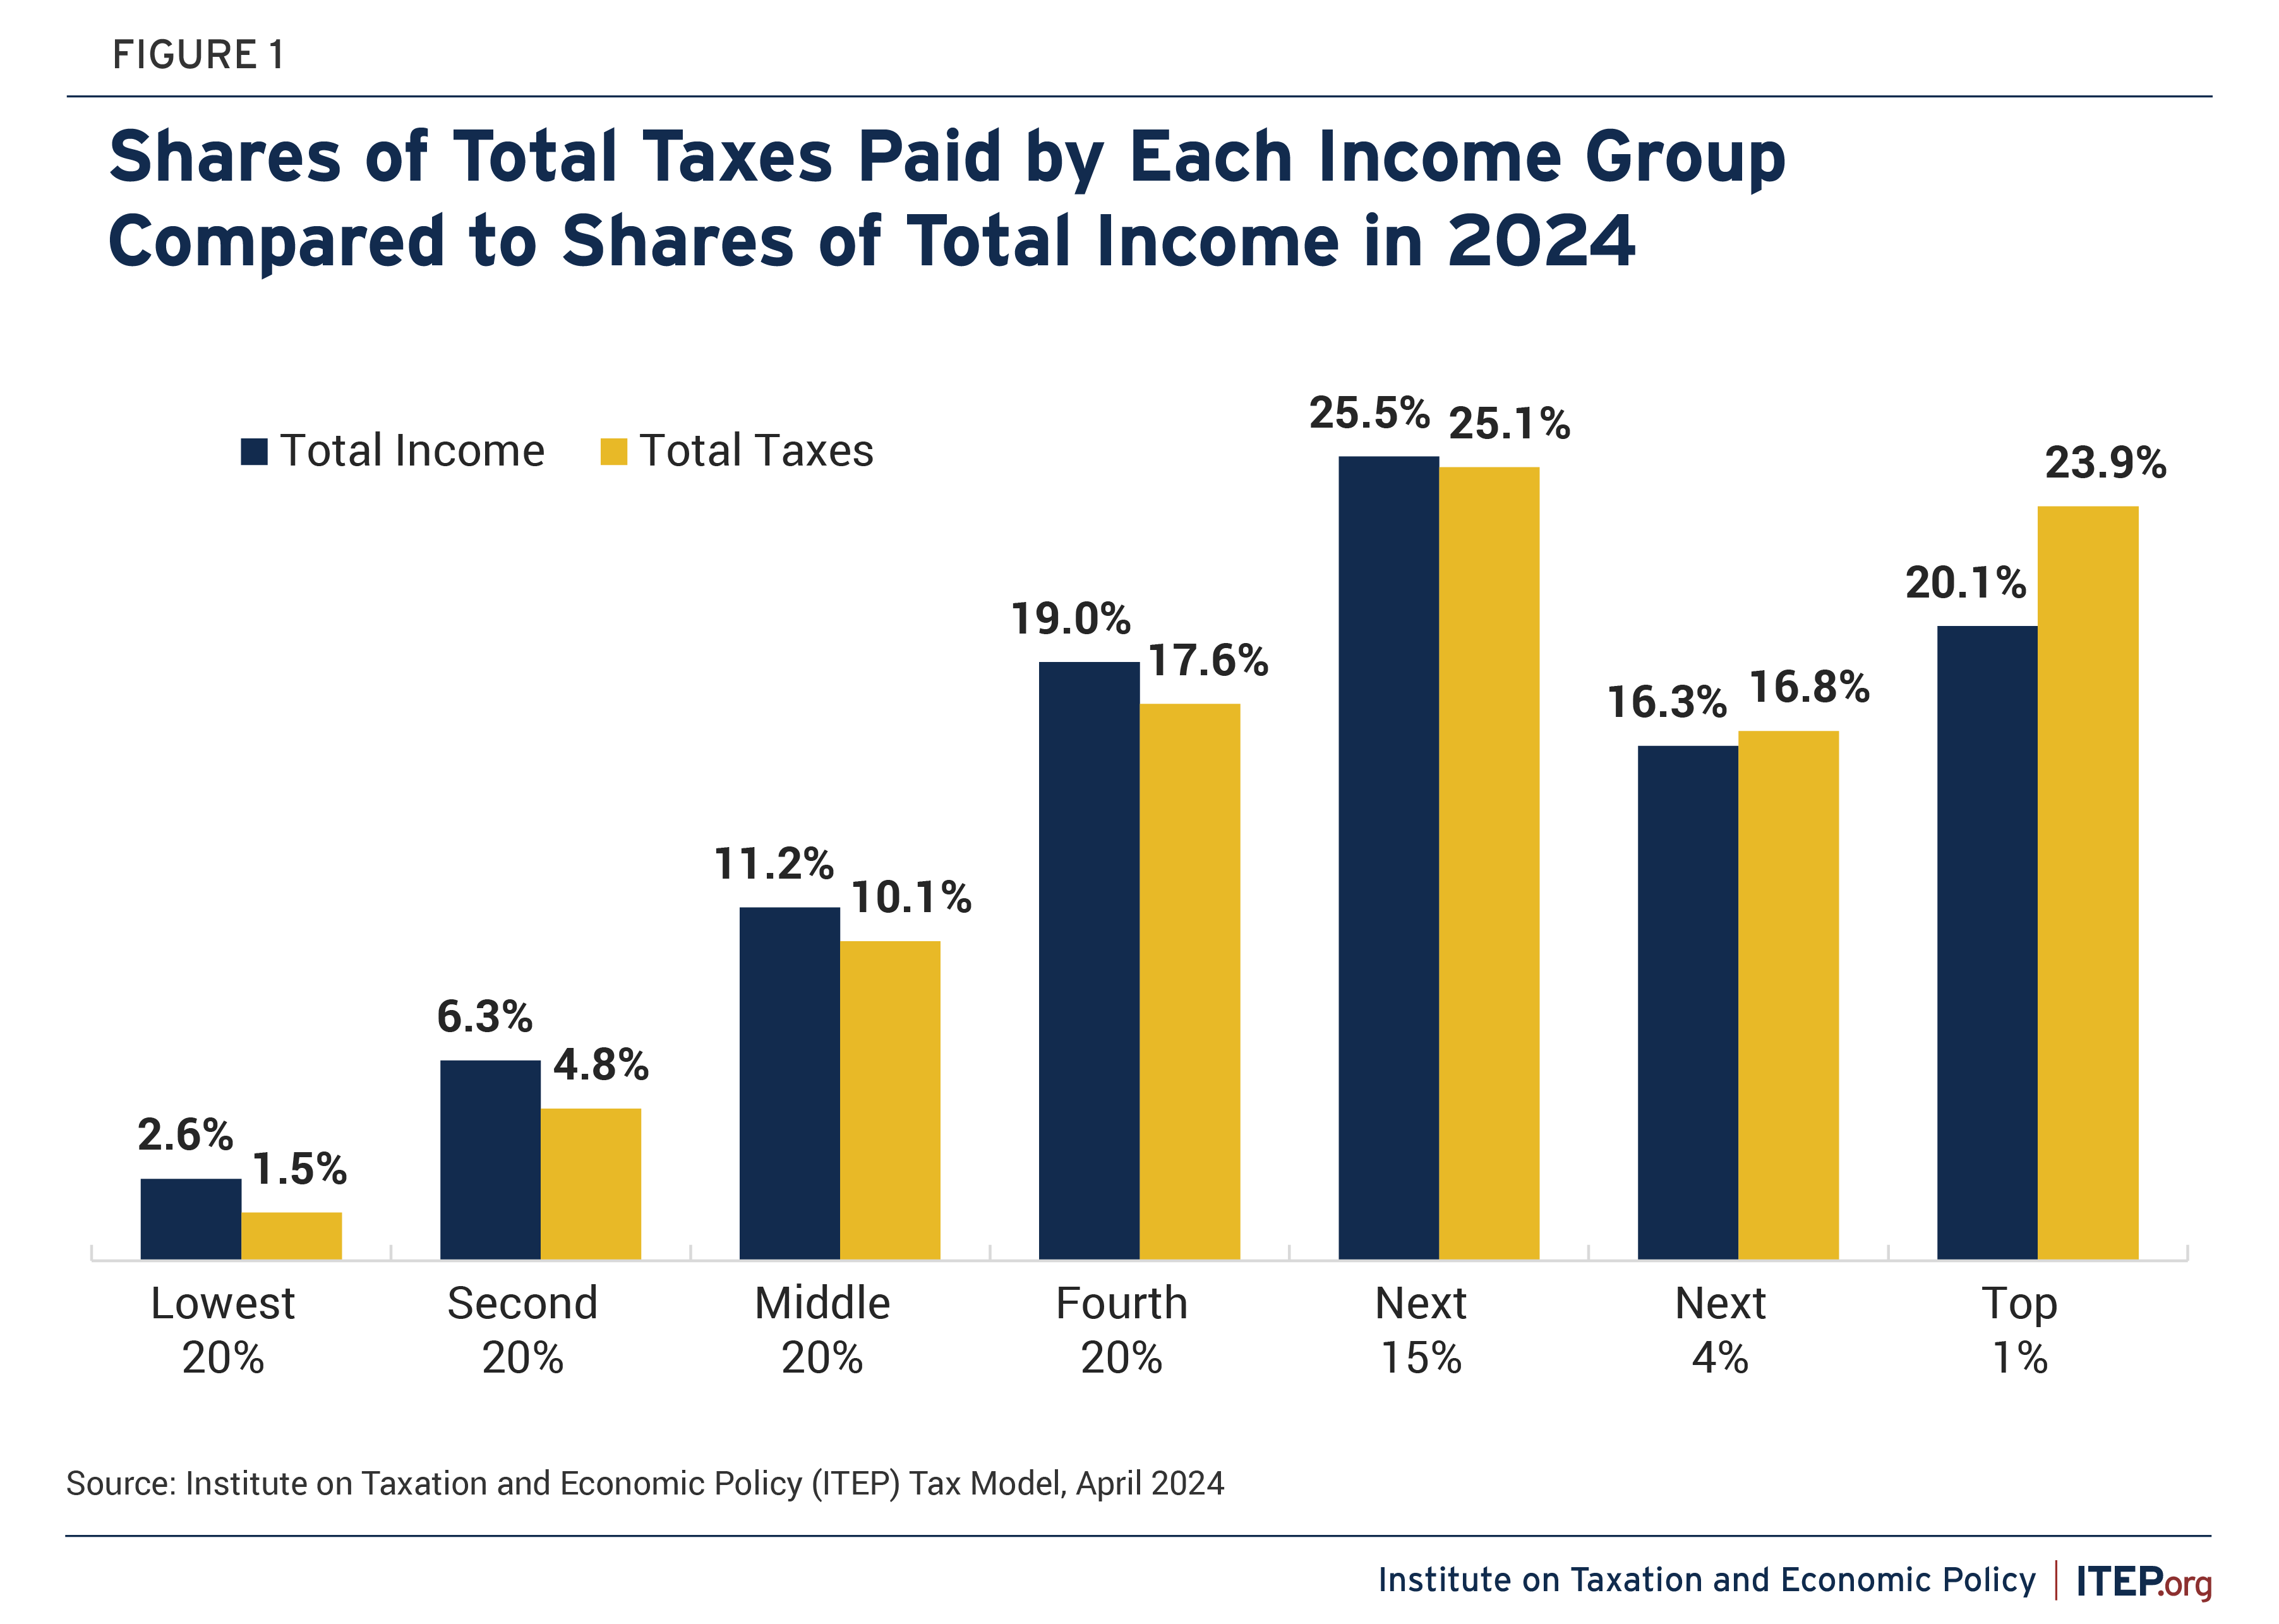
Incomes and Federal, State & Local Taxes in 2024
| Shares of total | Taxes as % of income | ||||||
| Income group |
Income range |
Average cash income |
Income | Taxes | Federal taxes |
State & local taxes |
Total taxes |
| Lowest 20% | Less than $27,100 | $15,400 | 2.6% | 1.5% | 3.6% | 13.5% | 17.1% |
| Second 20% | $27,100–$51,500 | $38,900 | 6.3% | 4.8% | 10.0% | 12.2% | 22.2% |
| Middle 20% | $51,500–$86,800 | $67,400 | 11.2% | 10.1% | 15.0% | 11.5% | 26.4% |
| Fourth 20% | $86,800–$147,300 | $115,200 | 19.0% | 17.6% | 16.1% | 11.1% | 27.2% |
| Next 15% | $147,300–$308,600 | $197,400 | 25.5% | 25.1% | 19.0% | 9.9% | 28.8% |
| Next 4% | $308,600–$771,100 | $454,400 | 16.3% | 16.8% | 21.5% | 8.6% | 30.1% |
| Top 1% | $771,100 and above | $2,502,100 | 20.1% | 23.9% | 25.5% | 9.2% | 34.8% |
| ALL | $118,100 | 100.0% | 100.0% | 19.0% | 10.3% | 29.2% | |
| Bottom 99% | Less than $771,100 | 80.8% | 76.0% | 17.1% | 10.4% | 27.5% | |
Notes:
a. Includes virtually all federal, state & local taxes (personal and corp. income, payroll, property, sales, excise, estate).
b. For calculations of income shares and taxes as a % of income, income includes employer-paid FICA taxes and corporate profits (net of taxable dividends and gains on corporate stock sales), neither of which is included in the average cash income figures.
Source: Institute on Taxation and Economic Policy (ITEP) Tax Model, April 2024
