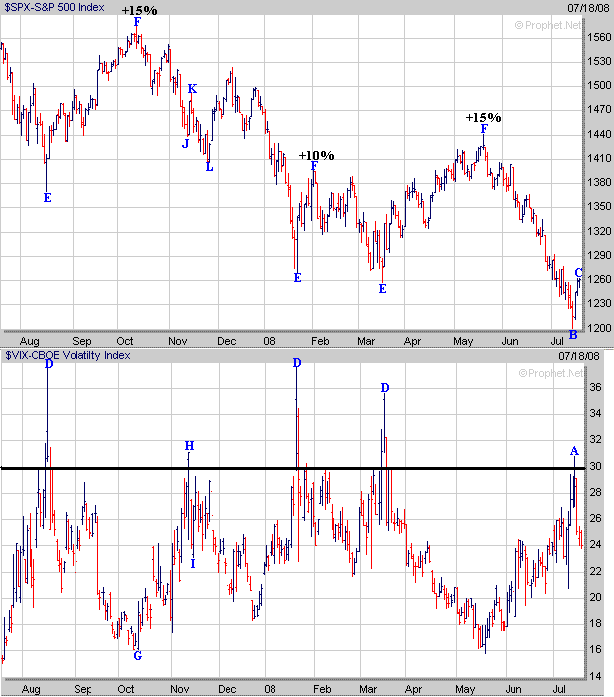
As talked about the past few weeks if the Volatility Index (VIX) rose above the 30 level (point A) that would likely lead to an oversold bounce which occurred this week (points B to C). However keep in mind the VIX peaked much lower than what occurred in mid March, mid January and mid August (points D) which were followed by significant oversold rallies (points E to F) ranging from 10% to 15%. Overall the VIX is acting similar to what occurred last November when it rose substantially (points G to H) and got just above the 30 level which was then followed by a sharp pullback (points H to I) as the S&P 500 briefly rallied (points J to K). This was then followed by another move lower before the real bottom occurred a week and a half later in late November (points K to L). Thus although it appears we have seen a short term bottom it's not totally out of the question that something similar to last November could also develop over the next week or so. 
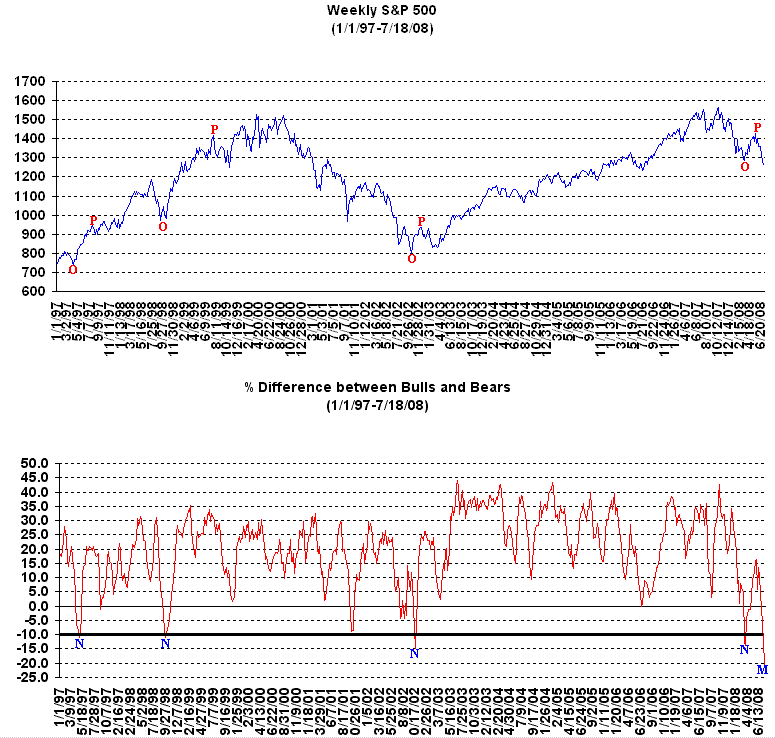
Meanwhile the % difference between the Bullish and Bearish Investment advisors reached an 11 year low this week as it dropped to just below -20% (point M). At least since the mid 1990's when the % difference has dropped to -10% or below (points N) this has been followed by some substantial oversold rallies (points O to P).
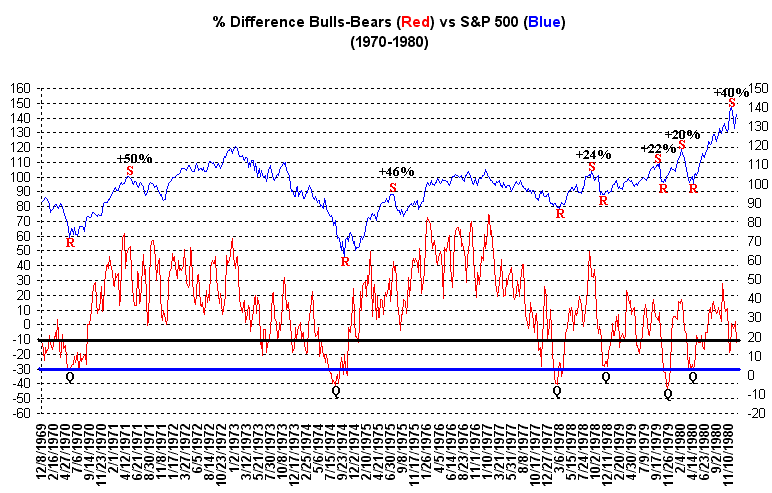
However keep in mind although this has worked well going back to the mid 1990's if we go even further back to the period from 1970 through 1980 you can see that the % difference between the Bullish and Bearish Investment Advisors reached far more extreme levels than we have seen since the mid 1990's. Back in the 1970's the % difference dropped to -30% or below (points Q) before significant oversold rallies occurred (points R to S). Thus even though the latest % difference between the Bullish and Bearish Investment Advisors has dropped just below -20% it could go even lower if we enter a period like the 1970's. 
As far as the major averages if the lows made on Tuesday (7/15) end up being a short term bottom here are some potential upside resistance levels to watch over the next few weeks. The first area of upside resistance for the Dow would be at its 23.6% Retracement Level (calculated from the October 2007 high to the July 15th low) near 11600. If the Dow can rise above that level then the next area of upside resistance would be at its 50 Day EMA (blue line) near 11850.
The Nasdaq has risen back to near its 23.6% Retracement Level around 2320 (calculated from the October 2007 high to the mid March low). If the Nasdaq can rise above the 2320 level then it should make a run up to either its 50 Day EMA (blue line) near 2360 or its 200 Day EMA (green line) around 2425 which also coincides with its 38.2% Retracement Level.
As far as the S&P 500 it's first area of upside resistance would be at its 23.6% Retracement Level (calculated from the October 2007 high to the July 15th low) near 1290. If the S&P 500 can rise above the 1290 level then its next area of upside resistance would be at its 50 Day EMA (blue line) near 1310.
Overall if the major do follow through to the upside over the next few weeks this will likely just be a typical oversold Bear Market Rally which will eventually be followed by another significant downward move some time in the Fall.