The 10-day System works on the simple principle that when the markets (especially the S&P 500 index) are at 10-day relative highs or lows, the trend will change direction temporarily. A 10-day low happens when the closing price of a certain day is lower than the close of the last 10 days. This usually results in a strong bounce in price within 5 days. A 10-day high happens when the close is higher than the close of the last 10 days. The 10-day high's results are a little more erratic, but often the results are downward or at least flat movement for the next 5 days.
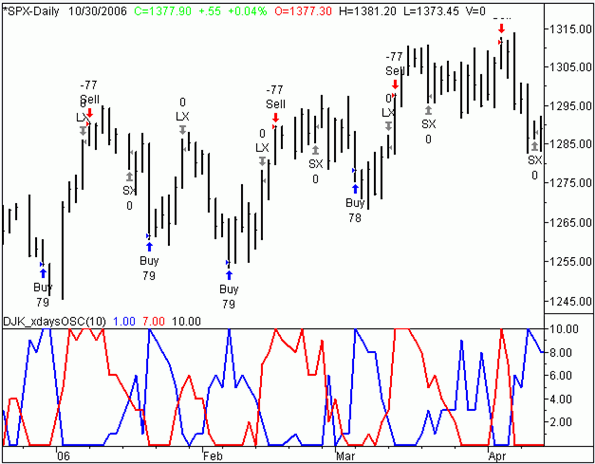
Here is the 10-day System chart from the first few months of 2006.

The blue arrows indicate a buy according to the system, which is the morning after a 10-day low is reached, while the red arrows indicate a sell signal the morning after at 10-day high is reached. This chart is a good demonstration of how accurate it can be at times. During strongly trending markets, the results are not quite as good, but it is still usually pretty good for predicting short pauses, at least, in the trend.
The 10-day lows are, by far, more useful then the 10-day highs. Since 1980, the 10-day lows have been an accurate predictor of short-term gains on the SPX index about 62% percent of the time. Simply buying the morning after a low signal and holding for exactly 5 days each time, as described above, would have yielded a gain of around 120% for the 26 year time period, and that is without reinvesting profits.
While that, in itself, is impressive, it is definitely not the only way that you can use the system. The 10-day System is probably best used to direct your other trades. For example, if you swing trade stocks or options and notice that the 10-day System hits a high signal, you might avoid or cut back on your bullish trades for a few days.
Price Headley is the founder and chief analyst of BigTrends.com.