|
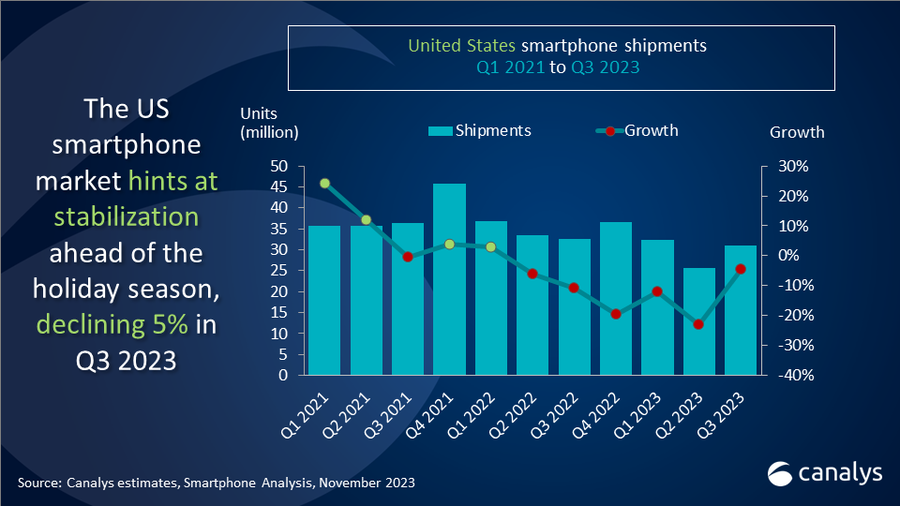
United States smartphone shipments and annual growth
|
|||||
|
Vendor |
Q3 2023 |
Q3 2023 |
Q3 2022 |
Q3 2022 |
Annual |
|
Apple |
17.2 |
55% |
18.6 |
57% |
-8% |
|
Samsung |
6.8 |
22% |
7.8 |
24% |
-12% |
|
Motorola |
2.8 |
9% |
2.4 |
7% |
14% |
|
TCL |
1.3 |
4% |
1.6 |
5% |
-15% |
|
|
1.2 |
4% |
0.6 |
2% |
117% |
|
Others |
1.7 |
5% |
1.6 |
5% |
6% |
