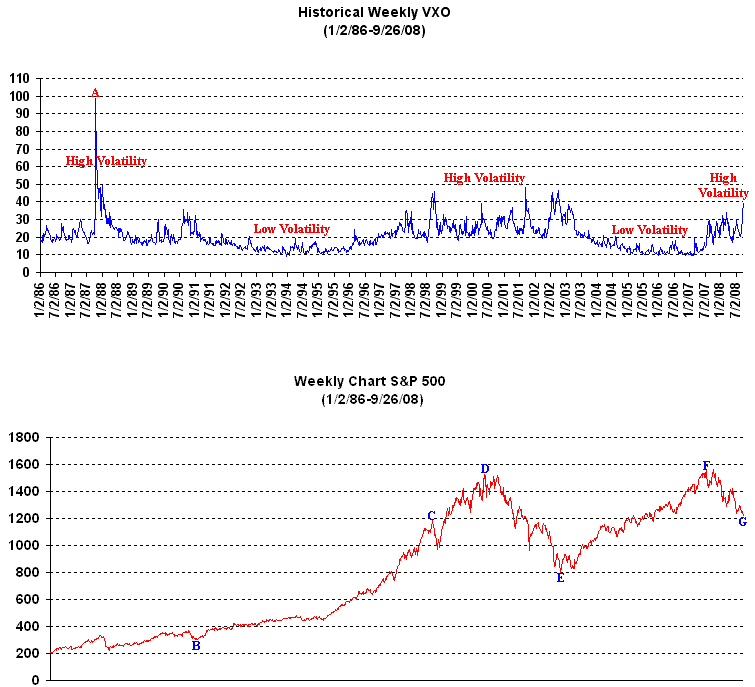
A longer term chart of the Volatility Index (VXO) going all the way back to the mid 1980's shows there have been periods of low and high volatility. There was high volatility in the mid to late 1980's which included the October 1987 crash in which the VXO rose to around 100 (point A). This was followed by a period of lower volatility from the early 1990's until the late 1990's in which the S&P 500 basically was in a steady up trend (points B to C). However beginning in 1998 the volatility began to increase again which continued through 2002 which was followed by an eventual top in the S&P 500 and a Bear Market (points D to E). Meanwhile beginning in 2003 the volatility began to decrease and remained rather low through the middle part of 2007 which was accompanied by a Bull Market environment (points E to F). However since the middle part of 2007 the volatility has been increasing again as the market has switched to a Bearish environment (points F to G). 
VXO and SP500
登录后才可评论.